Perkly is a fictional deals marketplace, invented for this exercise. The question: how do you build the system that decides what each customer sees, makes it smarter every time they come back, and shows it is actually making money?
Working prototype
A phone-sized Explore feed with the customer profile, event log and ranking trace updating beside it. Best on a desktop screen. All deals, merchants, margins and model coefficients are synthetic demo data.
Open the live prototype ↗
The problem
Millions of customers a month, hundreds of thousands of deals across local services, things to do, travel and goods, three customer segments — and yet a single experience for all of them.
- Goals: grow margin, and get more customers to buy again within 30 days.
- Capacity: three engineers, half a data scientist, half a designer.
- In short: build the system that decides what each customer sees, make it smarter every time they come back, and show how we would know it is making money.
Three segments, and what to learn about each
Three segments that matter to the business, map to feature-rich deal categories, and have enough volume to train a model on. For all of them the platform already has basic demographics, searches, views, purchase and redemption history, and merchant locations. What is missing is preference — and the answer is to learn it from behaviour rather than ask for it.
Travel seekers
- Preference axes: budget ↔ premium · day trip ↔ long stay · close to home ↔ far away · relax ↔ culture and sights · beach.
- Learned from behaviour: destination type, trip and accommodation type, stars, board, season, family or couples-friendly, flight, spa or pool, cancellation terms.
Beauty and wellness
- Preference axes: budget ↔ premium · pampering ↔ active · at a venue ↔ comes to you · standard ↔ luxury · proximity.
- Learned from behaviour: treatment type and area, facility type and facilities, indoor or outdoor, individual or group, couples-friendly, service level, brand, appointment flexibility.
Food and drink
- Preference axes: budget ↔ premium · everyday ↔ special occasion · just the meal ↔ class, tour or tasting · solo or couple ↔ group · proximity.
- Learned from behaviour: cuisine, meal and venue type, occasion, atmosphere, price level, menu, dietary options, drinks included, indoor or outdoor, reservation.
Signals that apply to every segment: price elasticity, discount percentage, rating and reviews, popularity, distance, gift intent, satiation (a similar purchase made recently) and ignored impressions.
Start with food and drink. Frequent, repeatable purchases give the fastest read on 30-day repeat, and the beta risk is contained.
How the system works
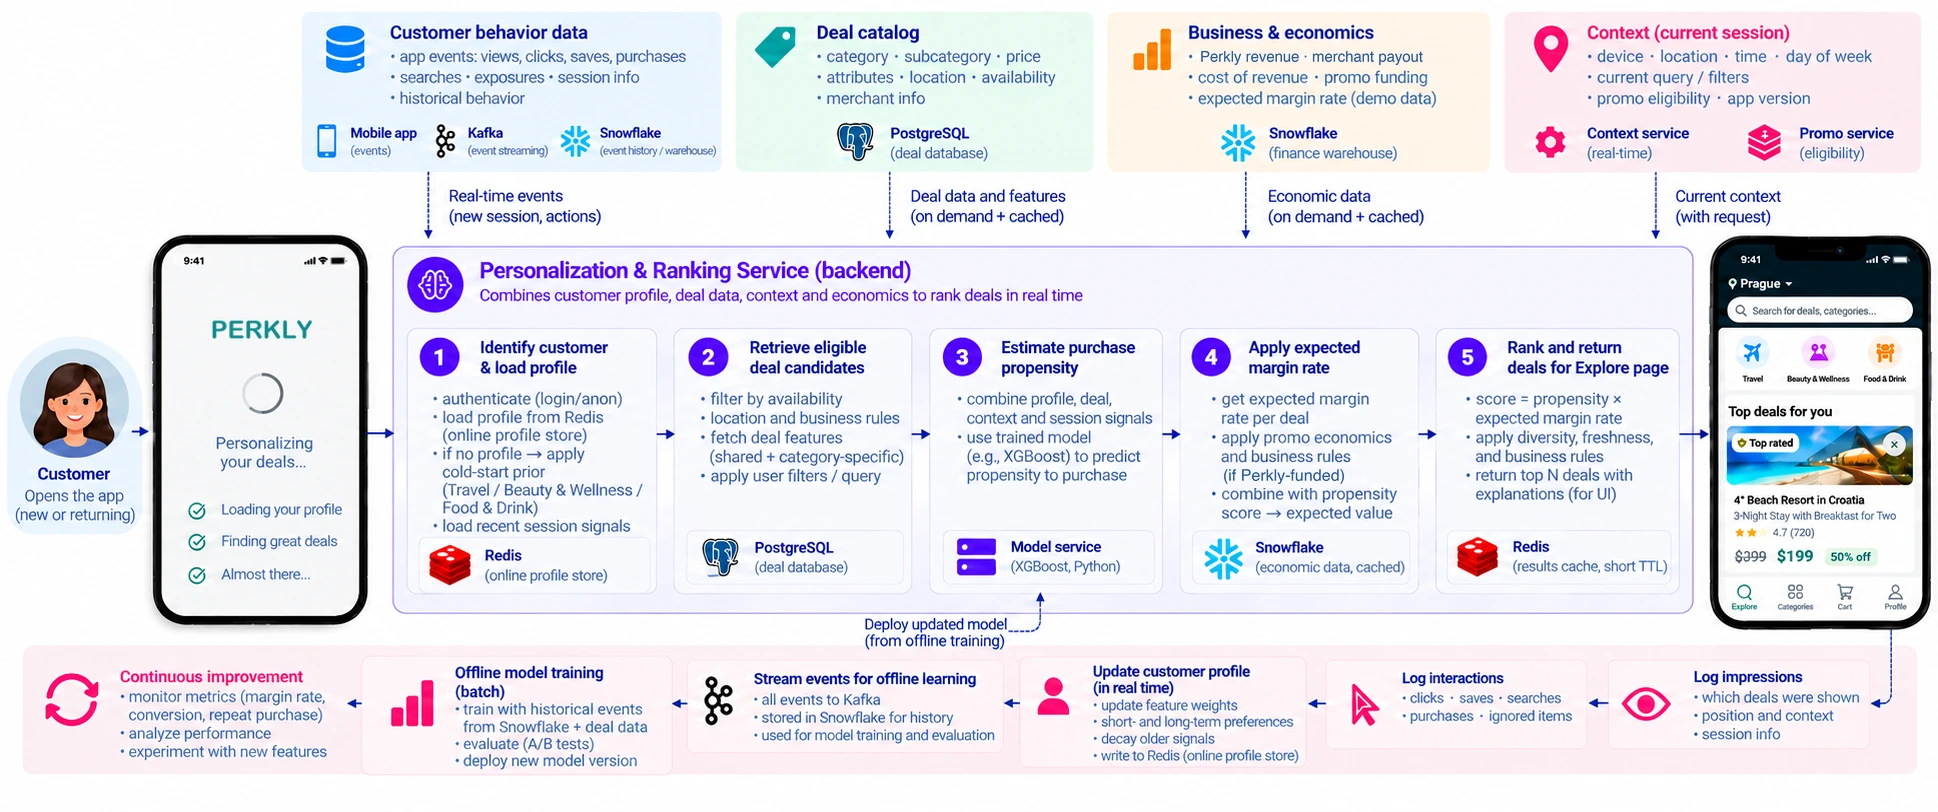
Click the diagram to open it full size.
A customer opens the app, new or returning. The backend then does five things in real time:
- Identify the customer and load their profile from an online profile store. With no profile yet, it falls back to a cold-start prior for the segment, plus whatever the current session already shows.
- Retrieve eligible deal candidates — filter by availability, location and business rules, and apply any search or filters.
- Estimate purchase propensity — a trained model (gradient-boosted trees) combines profile, deal, context and session signals.
- Apply expected margin rate — fetch the expected margin per deal, include promo economics and business rules, and combine it with propensity into an expected value.
- Rank and return the page — score is propensity × expected margin rate, then diversity and freshness rules, and the top deals go back with an explanation the UI can show.
Four sources feed it: customer behaviour (events streamed from the app), the deal catalog, business economics (revenue, merchant payout, promo funding — from the finance warehouse) and the current session context. Every impression and interaction is logged and streamed back: the customer profile updates in real time, and an offline pipeline retrains the model on the history and ships the new version.
The first three months
- Month 1 — foundations. Extract deal feature sets, audit event logging including impressions, and baseline the current Explore ranking.
- Month 2 — first model. Train a propensity model, build a margin-aware ranking service, and evaluate offline against the baseline.
- Month 3 — beta. A/B test in the starting segment, with guardrail dashboards and alerts and a weekly retraining pipeline.
Deliberately later: natural-language search (it needs a proven ranker and more design capacity) and personalised pricing (margin and trust risk).
Team split: engineer 1 on data and features, engineer 2 on the ranking service, engineer 3 on the app and experiments, the data scientist on the model and evaluation, the designer on the Explore UI.
How we would know it works
- Approach: A/B test against the current Explore experience.
- Primary outcomes: realised gross margin rate (take rate as a proxy) and 30-day repeat purchase rate, confirmed by research.
- Guardrails — must not drop: overall purchase volume and revenue, and customer satisfaction.
- Stop criteria: stop if a key guardrail falls beyond a pre-defined threshold, or if deal relevance is clearly worse.
- Before rollout: validate ranking relevance and the UX internally, then run a controlled beta against a control group.
Challenging the plan
Pre-mortem. Six months in, it has failed: we were not able to match what customers prefer to the deals we show efficiently enough. The experience did not improve — it only became harder to maintain. The two things that would make that likely: a small team, and margin-seeking that skews the results.
Contrarian view. "More personalisation is always better" is wrong for a marketplace people visit to find something new. Many come to step out of the ordinary, and over-personalising turns the feed into more of the same. So serendipity has to stay in the design: reserve roughly 15% of slots for exploration (new merchants, local trends), track discovery as the share of purchases in a new category, and treat serendipity as a feature rather than noise.
AI log
- Claude Code — built the prototype.
- ChatGPT — deep research, ideation and verification.
- What they got wrong: they misread the company goals — interpreting margin incorrectly and proposing to maximise revenue instead. Revenue and margin are different objectives, so this had to be caught and corrected by hand.